
Market history

Historic Recessions

Market losses look clean on a chart after the fact. They felt different in real time: lower account balances, slower hiring, weaker housing markets, and harder decisions for people who were close to retirement. These are three periods worth looking at before deciding how much market risk to keep exposed.

Worker sitting on a rainy sidewalk outside an emptied early 2000s office with belongings in a box.
2000-2002

The dot-com bust did not end in one bad week.

Internet stocks had pulled retirement money into one of the most crowded trades of the decade. When the bubble broke, losses kept showing up across 2000, 2001, and 2002.

For older investors, the problem was time. A younger saver could wait. Someone five years from retirement had to decide whether the next statement was worth riding out.
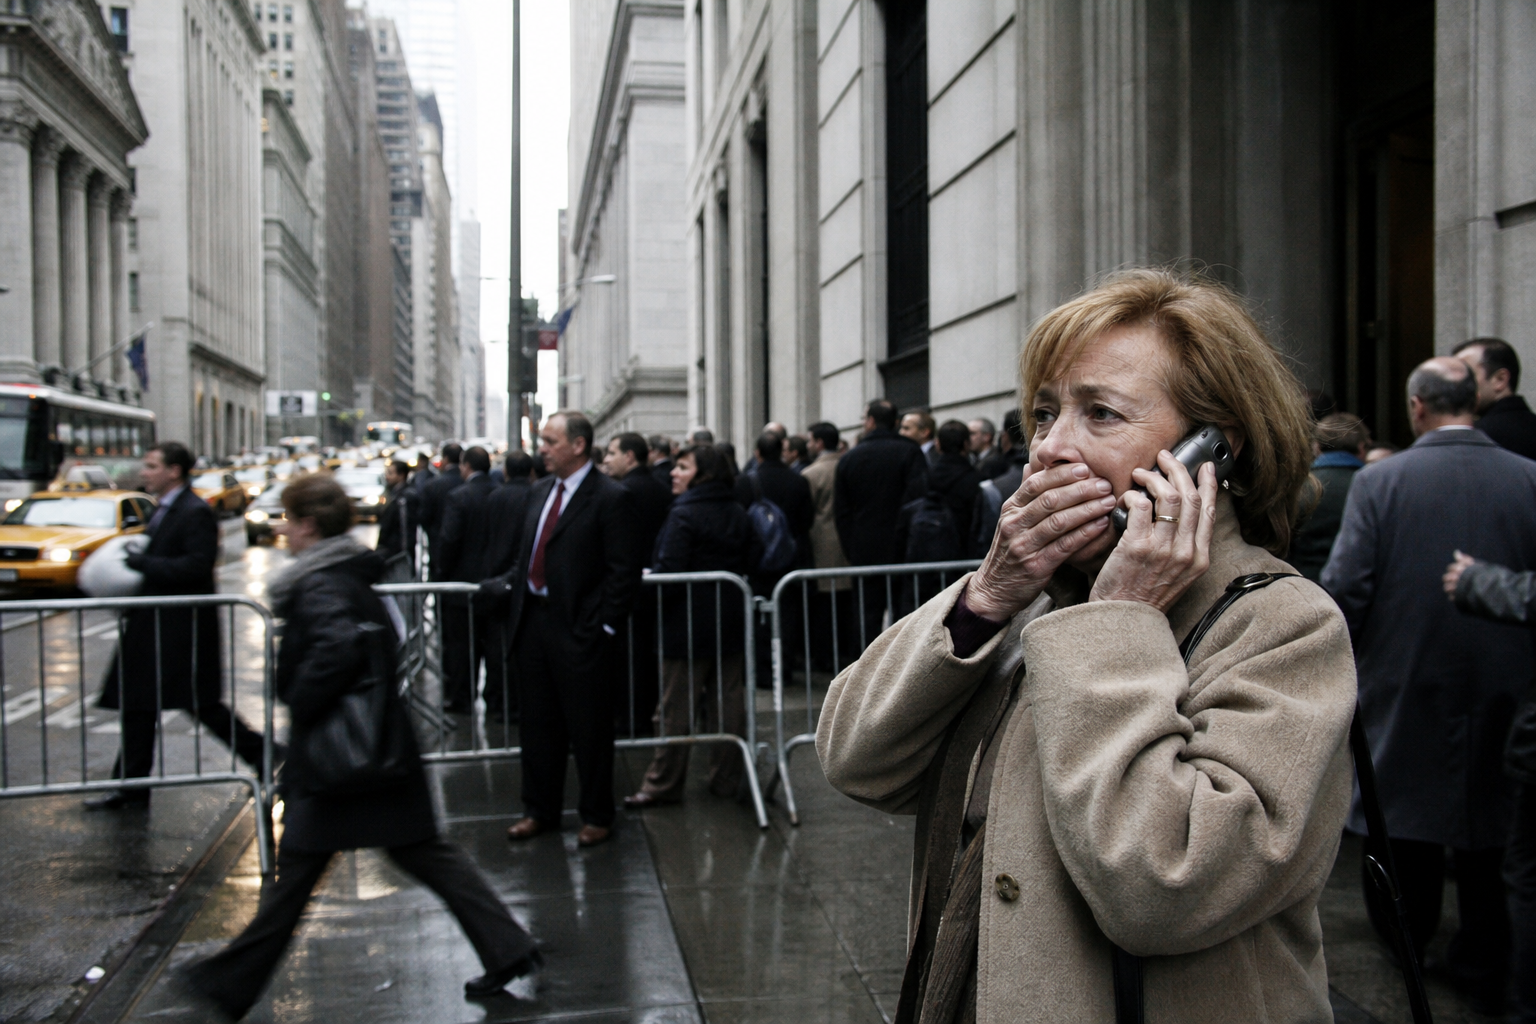

Woman on a phone outside a crowded New York financial district building during the 2008 crisis.
2008

The financial crisis moved from Wall Street to households.

What started inside banks and credit markets quickly reached retirement accounts, home prices, small businesses, and payrolls. By the end of 2008, many families were watching several sources of security weaken at once.

That is why the year still matters in retirement planning. The loss was not only financial. It changed when people retired, how much they spent, and how much risk they were willing to keep.

Older couple at a gas station with groceries and a phone showing a falling account line during the 2022 inflation shock.
2022

2022 was a down year with higher bills attached.

This was not a replay of 2008. Inflation was the main story, and the response was fast rate hikes. Stocks fell, and bonds had one of their rougher years too.

For retirees and near-retirees, that combination was uncomfortable: account values were down while gas, groceries, insurance, and utilities took more of the monthly budget.

Recessions
$
S&P 500 Enter amount
Retirement account -
Annuity -

Loss estimate for the selected period. Retirement account assumes the chart's 70/30 mix.

Next step

Decide what should stay exposed.

The chart shows what market losses looked like in specific periods. The planning question is more personal: how much of the retirement account should remain fully exposed, and how much should be compared against protected annuity options?